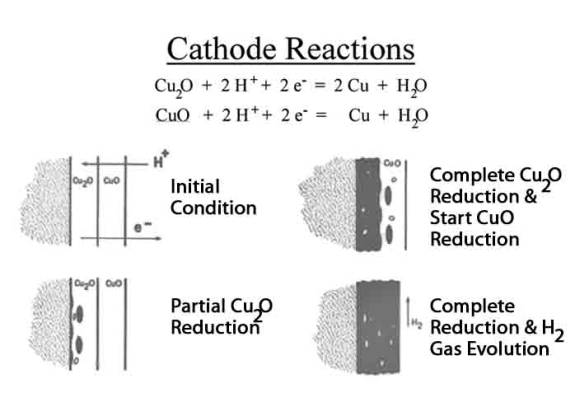

.

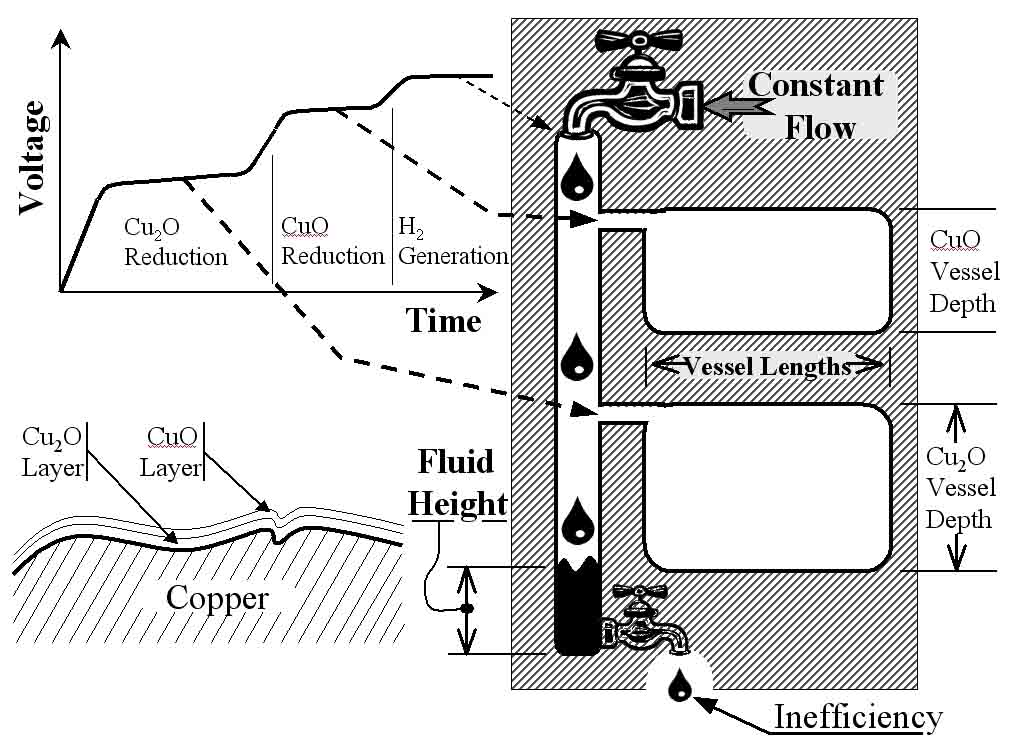
Figure 2: The upper-left shows a typical voltage-time curve generated by the surface oxide test. The plateaus in this curve correlate to the reduction of two layers of copper oxide as shown in the lower-left. The curve can also be correlated to a mechanical analogy, shown at the right, to aid in understanding the test.
Mechanical analogy for the surface oxide test:
The coulometric test is easily understood by chemists but often confusing to non-chemists. To make the concepts more easily understood a depiction of a mechanical analogy of the coulometric reduction is also shown in Figure 2. In the mechanical analogy there is a long vertical column that is being filled with fluid at a constant flow rate. Thus the flow rate of the fluid is analogous to the constant current applied to the electrochemical cell. In the mechanical analogy the fluid height would graph against time, analogous to the voltage versus time curve. When the fluid in the column reaches a height equal with the entrance of the first vessel, the fluid cannot raise any further until the vessel is completely filled. A fluid height versus time curve would plateau at this height. So this fluid height is analogous to the reduction potential of the first oxide to be reduced, the cuprous. Once the lower vessel is completely full the fluid height begins to rise again. Until the next vessel is reached and another plateaus is created on the fluid height versus time curve. When the upper vessel is also full, the fluid height rises to its highest level where it remains constant with time. Thus, the final flat plateau on the fluid height versus time curve becomes very flat and represents the end of the test. In the electrochemical cell the end of the test is evidenced by hydrogen bubbles forming on the rod while the voltage remains constant. Analyzing the fluid height versus time curve, would reveal the depth of the vessel similarly to how the voltage versus time curve reveal the constituent thickness� through Equation #1. To calculate the depths of each vessel we would need to know the length and width of the vessels. Thus, the horizontal surface area of the vessels is analogous to the surface area of the rod sample immersed in the electrolyte. Then with the constant flow rate known:
Thickness = current * time * K / surface area
[1]
Depth = (flow rate) * time / (horizontal area)
[2]
Reduction Efficiency:
This mechanical analogy is so useful because it illustrates
a deeper concept in the surface oxide test.
In Figure 2, there is also a faucet at the bottom of the column, which
represents inefficiency. In this
analogy, if there is any leakage from the bottom faucet, the Equation #2
calculation results in a deeper value than the physical Depth.
Thus, with the bottom faucet flowing, Equation #2 is modified:
Depth =
efficiency * (flow rate) * time / (horizontal area)
[3]
It is very important to understand that in the surface
oxide test the formation of free hydrogen is analogous to the top flow rate of
water and it can be measured extremely accurately.
However, that hydrogen released does not completely go towards reducing
the surface oxides. The easiest
understood reason for this is when dissolved oxygen is available in the
electrolyte, since the hydrogen preferentially bonds with the dissolved oxygen
near the copper surface. Along with
dissolved oxygen, high current density, electrolyte contamination and
electrolyte weakness will also reduce this reduction efficiency.
Thus, to properly solve for oxide thickness�, Equation #1 must be
multiplied by an efficiency factor as was the analogous Equation #3.
It is very possible to develop fairly accurate measures of efficiency
versus only one parameter. For
example, the efficiency versus current density can be determined but only if
every other influential parameter is well maintained, ala the corrosion lab.
The combination of influences is much more complicated, especially
without thorough sample cleaning which introduces a practically infinite level
of contaminant variations.
![]()