A big influence on test variation is the method by which the voltage-time curve is analyzed. Curve analysis methods vary from tester to tester. It is important that these methods are consistent for proper comparison. Taking short-cuts in the curve analysis will lead to significant decrease in accuracy and repeatability.
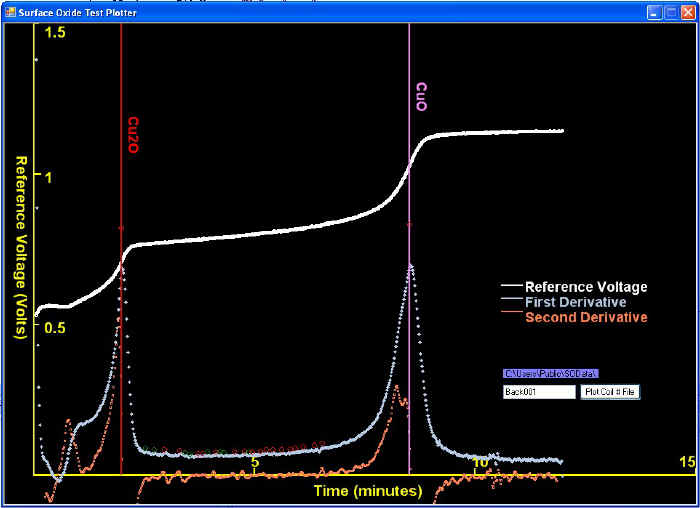
The goal of the voltage-time curve analysis is the find the inflection points that separate the time-periods where different constituents were being reduced. Many curves are simple to analyze. For example, a screen shot of our Test Capture Software (below) show a voltage versus time curve that behaves classically and thus is very simple to solve. Thus the two vertical lines match the main peaks in the first derivative, which is also the points where the second derivative is nearest to zero.
However, it is likely that tests will be produced where there are more or less than two clear inflection points for which to chose. There are multiple reasons for this, but just three major reasons will be addressed here:
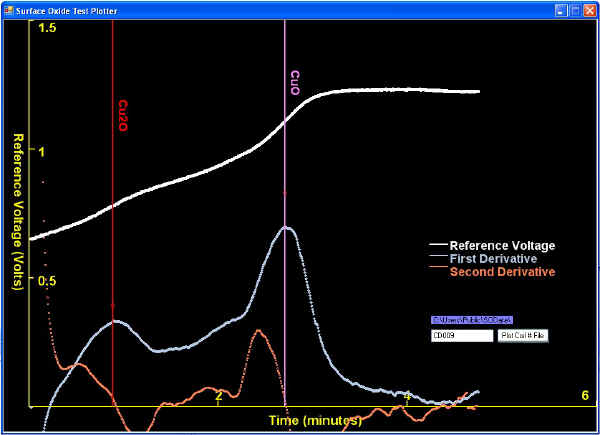
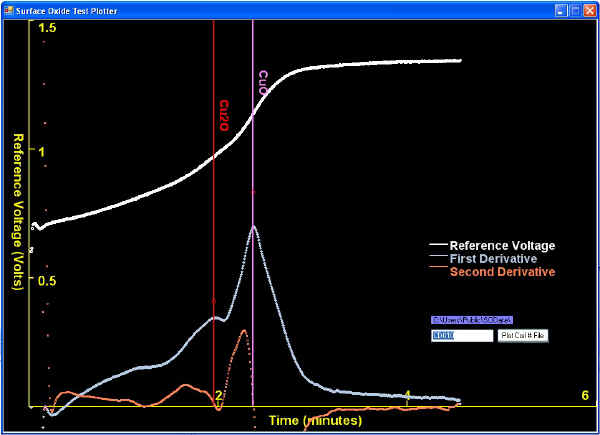
| When surface oxide thickness' are thinner than typically seen, they might be analyzed with too high of a current density to reveal clear plateaus. This is not big concern in the rod producing QC Labs because the Lab Manager just wants to know that the oxides are low enough. Two examples of solved tests revealing thin oxides are shown below: |
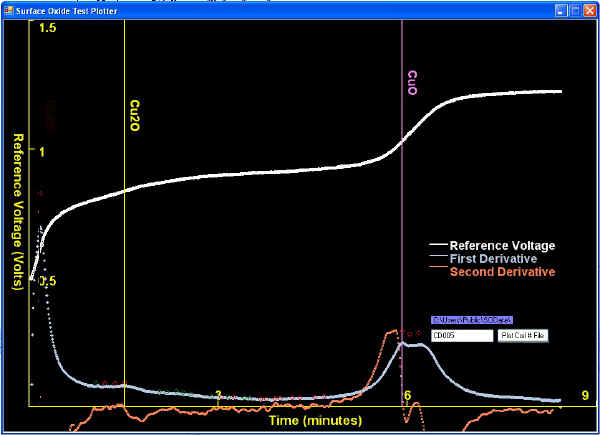
| Sometimes a first derivative peak (corresponding to an inflection point) is much subtler (lower) than other first derivative peaks, as shown below. |
| Also, there are tests where more than only copper oxides exist and thus, other constituents such as sulfides, sulfates, chlorides, etc. must be considered in the analysis. | |
Many more example curves are shipped with our system.
![]()