
What are the composition of surface films?
How are surface films created?
How are surface films measured?
What is Coulometric Reduction?
What is Electrochemical Impedance Spectroscopy?
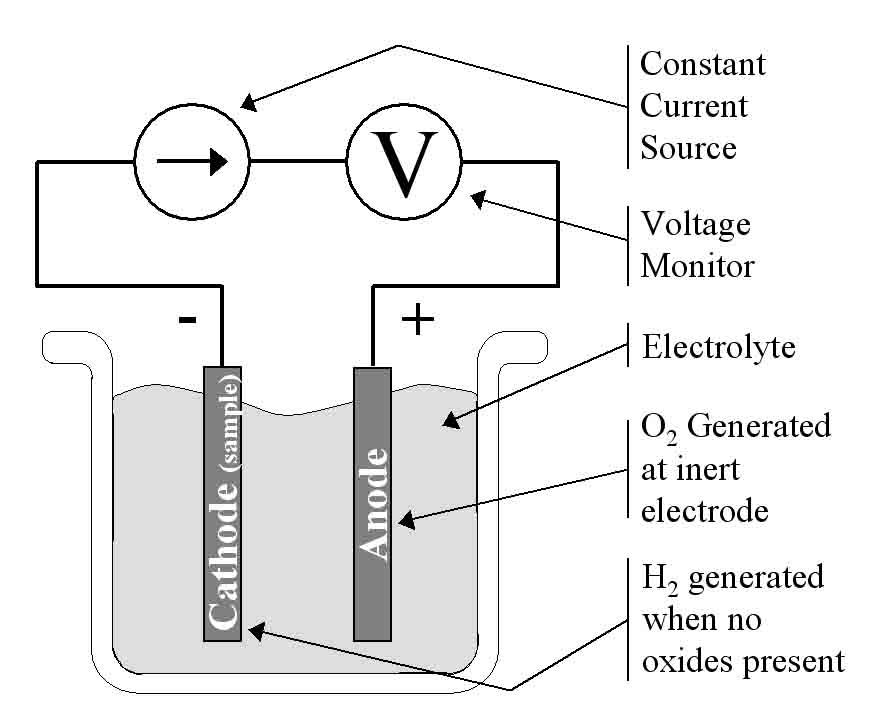
Figure 1: This is the simplest coulometric reduction cell where a constant current loop is created through the electrolyte. The cathode is the sample to be tested and a percentage of the hydrogen generated at the cathode goes towards reducing any oxides present.
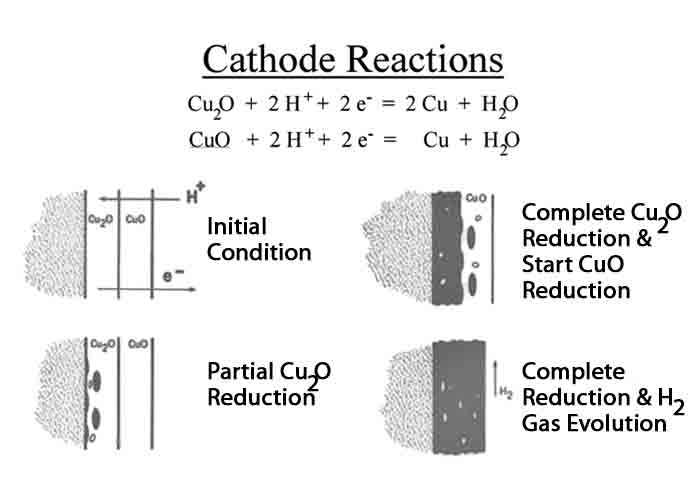
Figure 2: Hydrogen formed on the surface diffuses through the oxide layers and reduces the oxide to metal and water. In the case of copper the Cuprous (Cu2O) is reduced first and then the cupric (CuO). This is a very simplistic illustration. In fact, these two constituents are often present in a mixed layer. From Pops and Hennessy [2].
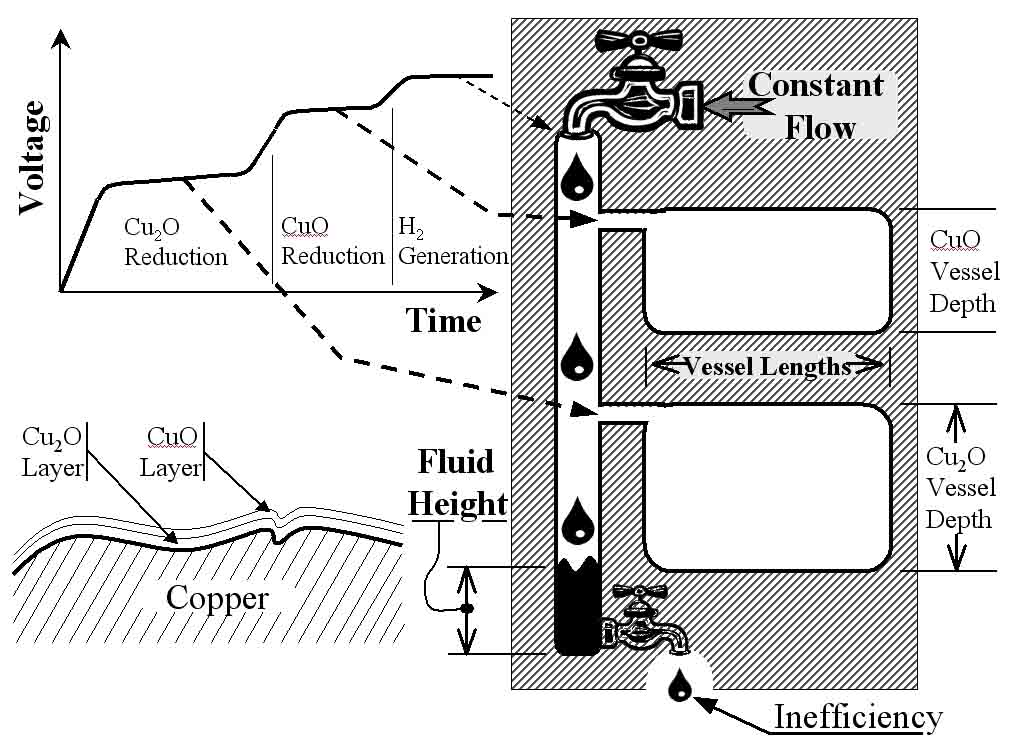
Figure 3: The upper-left shows a typical voltage-time curve generated by the surface oxide test. The plateaus in this curve correlate to the reduction of two layers of copper oxide as show in the lower-left. The curve can also be correlated to a mechanical analogy, shown at the right, to aid in understanding the test.
Figure 4: At low levels of current density the actual physical oxide thickness� are accurately measured. As current density increases the oxide thickness measurements increase due to reduction inefficiencies. The two vertical lines illustrate current density recommended for corrosion samples and current density typically used on copper rod. The higher level doubles the oxide thickness readings. Representative normal distribution curves illustrate that the measurement variation is tighter at lower current density levels.
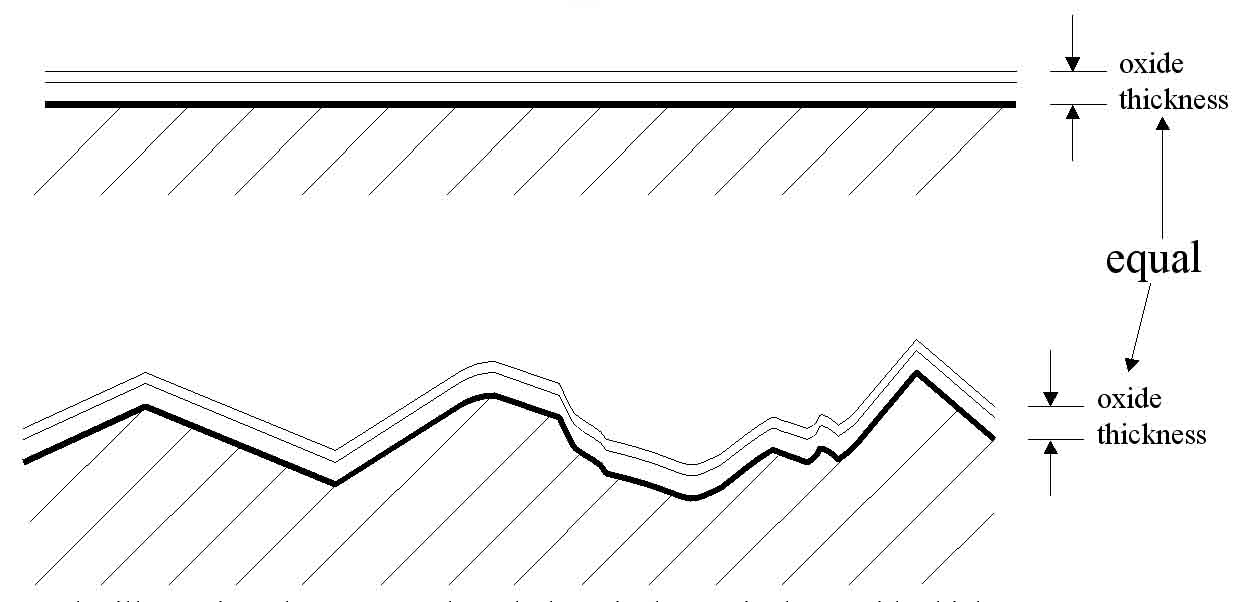
Figure 5: In the illustration above, even though there is the equivalent oxide thickness on both samples, the CR-only test will evaluate the bottom sample much higher because it has more real surface area.
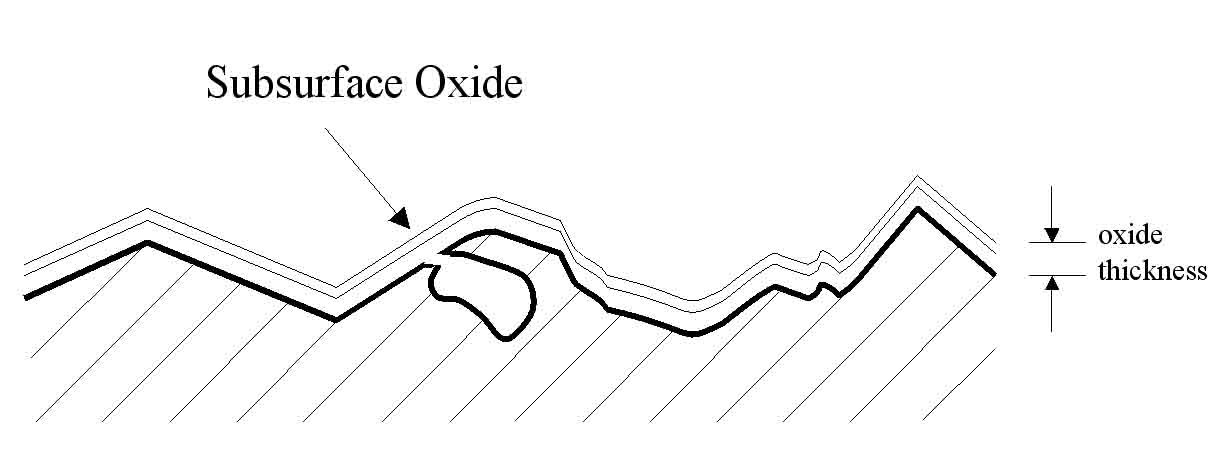
Figure 6: The charged electrolyte will also reduce subsurface oxides with exposure to the surface.
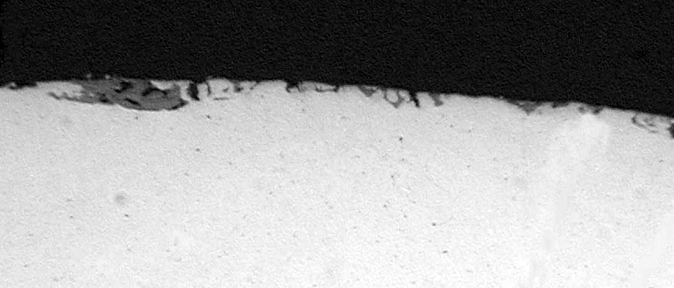
Figure 7: A metallographic section showing a copper rod with rolled in subsurface oxides that are exposed to the surface and thus would be reduced by the electrolyte.
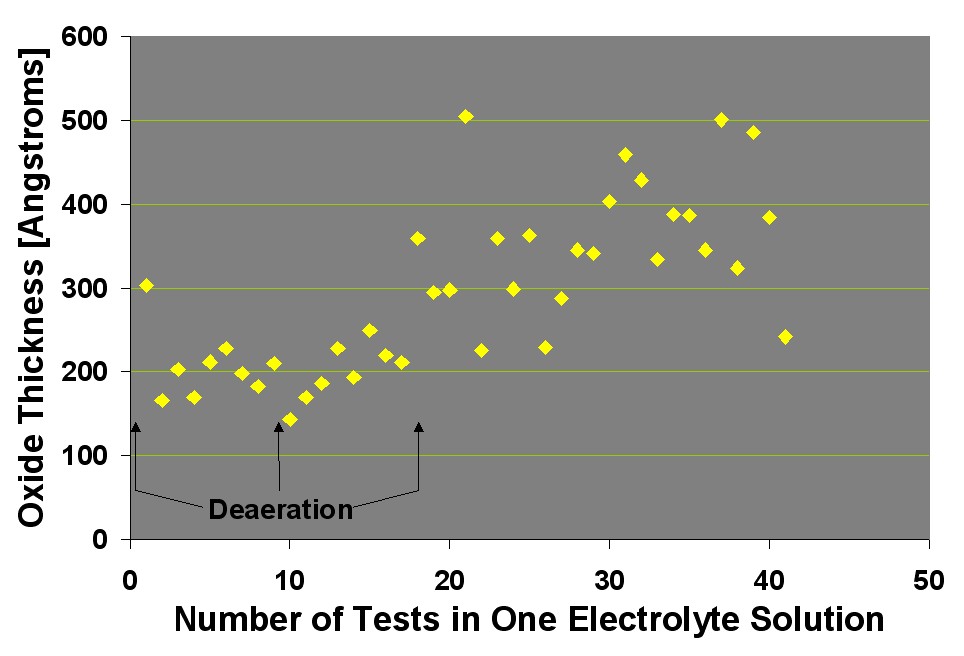
The figure above shows that after 17 tests in a small volume of electrolyte, the electrolyte must be replaced. The CI Surface Oxide Testers and the CSA use electrolyte volumes two times higher to decrease the frequency of electrolyte changes. On the other hand, the experiments represented in this figure had each rod sample solvent-cleaned, which is unlikely in QC labs. Deterioration of the electrolyte is may be associated with a change in pH, which decreased from its initial value of 11.2 to 10.5 after the forty-second test.
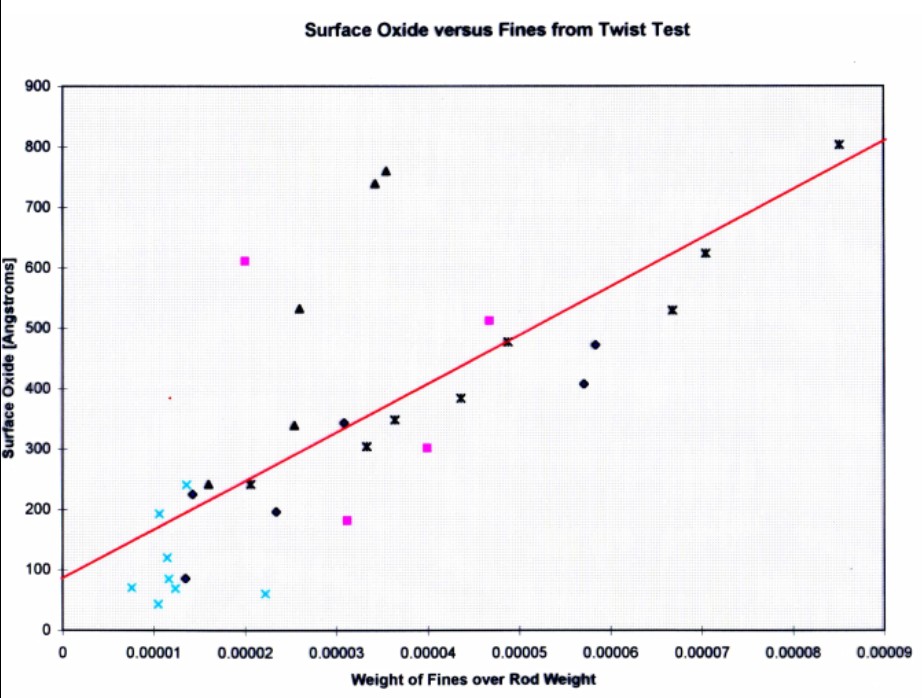
Figure 22. Results of fines-potential test for copper rod samples that were acid pickled, alcohol cleaned, and shaved.
![]()